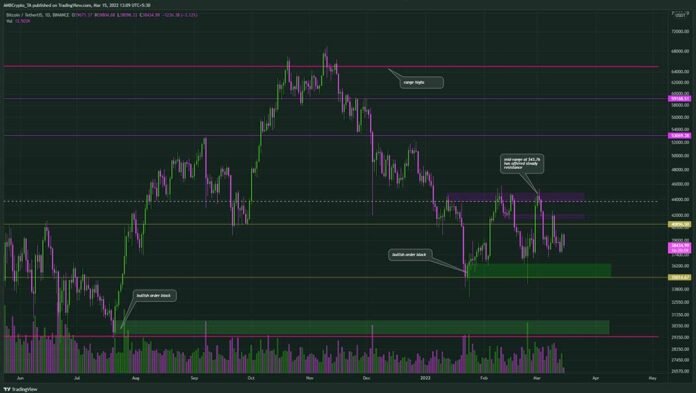
On the basis of analysis, it appears to be a pair of bullish order blocks for Bitcoin. These are the regions where the price fell, found buyers, and then made a quick, bullish rise away from them. The July one in the $30k range had already been tested several times in May and June. Furthermore, this level reflected the lows of an orange band in which Bitcoin has been trading for about 15 months. The $35k–37k range may see demand in the next few days, with prices rising to the $41.5k–42k range. The $42k and $44k price ranges are likely to be crowded with sellers. Furthermore, the $43.7k mark symbolises the midpoint of BTC’s long-term range.
Since late January, bitcoin has been making higher lows. The last lower high of the November-January downtrend, $44.5k, was broken in February. Despite the scary market circumstances, Bitcoin’s longer-term market structure may have shifted to the positive. As a result, a return to $35k may be a good time to purchase. The RSI was at 45, and it had been between 40 and 60 for the previous two months, indicating that momentum was not considerably in favour of either side in 2022. A breakthrough at either level might signal the start of the next phase for BTC.
The OBV saw some demand in early January, but has been on a downward trend since October, when BTC achieved its all-time high. At the time of publication, it was once again dropping downward.
BTC’s price behaviour and indications suggested that an additional decline was possible. A move below 40 on the RSI might be used to anticipate opportunities to purchase Bitcoin at or near the range lows. In contrast, the $44k range may be used to sell BTC. Before the longer-term bias may be considered to have moved, the mid-range at $43.7k and the local highs at $45.8k must be surpassed.


