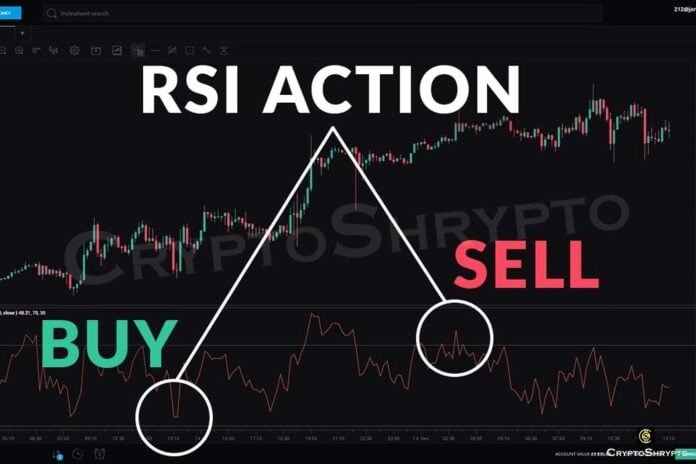
Welles Wilder Jr. created the Relative Strength Index (RSI) and published it in his book “New Concepts in Technical Trading Systems” in 1978. Relative Strength Index (RSI) is a technical analysis indicator that examines the size of recent price fluctuations to determine if a stock or other asset is overbought or oversold. The RSI is represented by an oscillator (a line graph that travels between two extremes) with a range of 0 to 100.
Values of 70 or higher on traditional RSI usage signal that an investment is becoming overbought or overvalued, and may be ready for a trend reversal or corrective retreat in price whereas a reading of 30 or less on the RSI suggests that the market is oversold or undervalued.


